
Introduction
In the following blog post, I will investigate the results that I have got when carrying out Hooke's Law experiment. Hooke's Law states that: "Within the limit of proportionality, the extension of a material is proportional to the applied force."(1) For instance, if we have a spring, and we apply loads of different weights to it, its extension would increase as the weights increase, given that the spring hasn't exceeded its limit of proportionality. Hooke's Law is demonstrated using the following equation:
F=kx, (Equation 1)
where, F= Force (N), k = Spring constant (N/m), and x = extension of the spring (m)
where, F= Force (N), k = Spring constant (N/m), and x = extension of the spring (m)
When the spring's limit of proportionality is exceeded, it will no longer follow this law and it will no longer return to its original length when the weights are removed. When the elastic material exceeds its elastic region, it becomes in its plastic region. (2)
Hooke's Law is demonstrated in the following diagram:
 |
| Figure 1: Hooke's Law diagram (3) |
Figure 1 shows us that when the force on the spring is doubled, the spring's extension doubles at the same time.
Here is a video that shows the method used to perform this experiment (4):
Video 1: Hooke's Law Method
The Experiment
Graphs of Y1 and Y2
In this experiment, we are given three materials, y1, y2, and z. Y1 and y2 are materials that are within their elastic region. Z has gone past its elastic region. Table 1 below shows the deformation (extension) of the springs as we have added the weights.
Table 1: Deformation of springs at different weights
Deformation (mm)
|
|||
X ( Newton)
|
Y1
|
Y2
|
Z
|
1.00
|
3.00
|
2.2583
|
2.375
|
2.00
|
4.50
|
4.3166
|
9.375
|
3.00
|
6.00
|
6.3749
|
28.375
|
4.00
|
7.50
|
8.4332
|
65.375
|
5.00
|
9.00
|
10.4915
|
126.375
|
6.00
|
10.50
|
12.5498
|
217.375
|
7.00
|
13.00
|
14.6081
|
344.375
|
8.00
|
14.00
|
16.6664
|
513.375
|
9.00
|
15.00
|
18.7247
|
730.375
|
Figure 2 below shows the relationship between the extension of the springs (y1 and y2) and the weights. A best-fit line was drawn between the points obtained from table 1.
 |
| Figure 2: Deformation Vs Force of y1 and y2 |
As we can see in Figure 2, the graphs of y1 and y2 look very similar. In both cases, there is a positive linear relationship between deformation and force. For example, for y1, as we increased the load from 2 Newtons to 7 Newtons, the extension increased from 4.50 millimeters to 13.00 millimeters. Similarly, for y2, as we increased the load from 4 Newtons to 9 Newtons, the extension increased from 8.4332 millimeters to 18.7247 millimeters. This shows that our data follows Hooke's Law.
Using the data from table 1 and figure 1, we are able to figure out the equation of lines y1 and y2 with Excel. The general equation of a straight line is: y=mx+c (Equation 2) where m is the slope, and c is the y-intercept. The line equation of y1 is: y1= 1.5583x+ 1.375 (Equation 3). The line equation of y2 is: y2= 2.0583x+ 0.2 (Equation 4).
The slope, m, is very important regarding this experiment, since its inverse would give us the spring's constant, k. This is because the slope in this case is the change in extension divided by the change in force . However, using equation 1, we can see that the spring's constant is force divided by extension. So, the spring constant of y1 and y2 is about 0.642 and 0.486 Newtons per millimeters squared, respectively. This means that y1 has a larger spring constant than y2, and so it can withstand more weight before reaching its plastic region. In addition to that, we can see that y2 is steeper than the y1. This is because y2 has a larger slope value (2.0583).
The y-intercept, c, shows the extension when no force is applied. The ideal y-intercept should be (0,0), just like figure 3 below. This is because the spring is not supposed to extend when no force is applied.
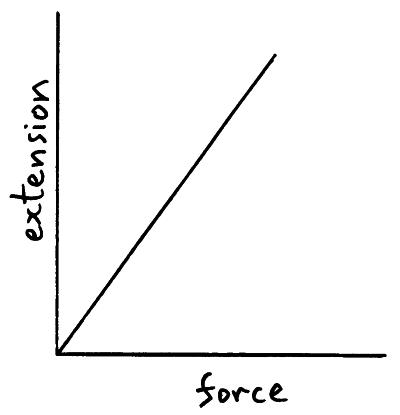 |
| Figure 3: Ideal Hooke's Law Graph (5) |
However, in this experiment, we have made some errors which have affected the results. What we can say in this case is that the values we have got for y1 are more accurate than the values we have got for y2. This is because y2's y-intercept is closer to 0, than y1's. The graph of y2 has a y-intercept of 0.2, whereas y1 has a y-intercept of 1.375.
Point of Intersection
The point of intersection between the graph's of y1 and y2 shows the point at which spring y1 and y2 would extend by the same amount when the same force is given to both. Visually, I think that the point of intersection lies at almost (2.5, 5.0). However, we can know the exact point of intersection by resolving using simultaneous equations. I will solving using elimination:
1) First, we need to subtract Equation 4 from Equation 3 to get rid of y.
y1= 1.5583x+ 1.375 (Equation 3)
-
y2= 2.0583x+ 0.200 (Equation 4)
=> 0 = -0.5x +1.175
2) Solve for x.
0.5x=1.175
x=2.35
3) Substitute the value of x into either of the equations and solve for y. I substituted the value of x into Equation 3.
y=1.5583(2.35)+1.375
y=5.037
Thus, the actual point of intersection is: (2.35, 5.037).
Graph of Z
 |
| Figure 4: Deformation VS Force of Z |
As we can see above in Figure 4, the graph of z differs from the graphs of y1 and y2. Unlike the graphs of y1 and y2, there is a positive exponential relationship between deformation and force, whereas the graphs of y1 and y2 have a positive linear relationship. In Figure 4 we can see that the rate of deformation increases as the force increases. This is because z has exceeded its elastic region, and is in its plastic region. As a result, we can no longer say that this material follows Hooke's Law (i.e since it is past its elastic region).
Conclusion and Evaluation
In Conclusion, we can see that materials y1 and y2 follow Hooke's Law, since their deformation is directly proportional to the force added. However, material z does not follow Hooke's Law, since it is past its elastic region.
As we have said earlier, we have committed some errors in this experiment, which have influenced our results. For example, we can see that in Figure 2, there is an anomalous reading (7,13.00) that does not lie in the best-fit line of y1. One of the errors that I may have committed is a parallax human error, where I may have not read the value of extension at eye-level. Next time, if possible, I should use a laser to measure extension. A demonstration of this error is shown below in Figure 5.
 |
| Figure 5: Parallax error (6) |
Also, the apparatus used may have not been calibrated well to conduct this experiment. A systematic error could have occurred in springs y1 and y2, since their graph does not hit the origin. A possible error could be that the springs I have used were used are not brand new. So, as other people used it, its spring constant could have decreased. Next time, we should use new springs to have accurate results.
Thanks for reading, and I hope that you have enjoyed it!
References:
(6) Antonine-education.co.uk, (2014). [online] Available at: http://www.antonine-education.co.uk/Image_library/Physics_3/parallax.JPG [Accessed 12 Nov. 2014].
(2) Bbc.co.uk, (2014). BBC - GCSE Bitesize: Hooke's Law. [online] Available at: http://www.bbc.co.uk/schools/gcsebitesize/science/add_aqa/forces/forceselasticityrev2.shtml [Accessed 12 Nov. 2014].
(1) Bird, J. and Ross, C. (2012). Mechanical engineering principles. 2nd ed. Oxford: Newnes, p.28.
(Title image)
Getty Images, (2014). Toy Slinky Spring On Black Background Close Up Stock Photo sb10062488b-001. [online] Available at: http://www.gettyimages.co.uk/detail/photo/toy-slinky-spring-on-black-background-close-high-res-stock-photography/sb10062488b-001 [Accessed 14 Nov. 2014].
(Title image)
Getty Images, (2014). Toy Slinky Spring On Black Background Close Up Stock Photo sb10062488b-001. [online] Available at: http://www.gettyimages.co.uk/detail/photo/toy-slinky-spring-on-black-background-close-high-res-stock-photography/sb10062488b-001 [Accessed 14 Nov. 2014].
(3) Hyperphysics.phy-astr.gsu.edu, (2014). Elasticity, Periodic Motion. [online] Available at: http://hyperphysics.phy-astr.gsu.edu/hbase/permot2.html [Accessed 12 Nov. 2014].
(5) Physicsnet.co.uk, (2014). [online] Available at: http://physicsnet.co.uk/wp-content/uploads/2010/06/hookes-law-graph1.jpg [Accessed 12 Nov. 2014].
(4) YouTube, (2014). Hooke's Law and springs - Physics. [online] Available at: https://www.youtube.com/watch?v=pVdGUTRI49E [Accessed 12 Nov. 2014].
Nice
ReplyDelete